The cracks started in housing
By the mid-2000s, US home prices had risen year after year and lending standards kept loosening. Subprime mortgages, loans to borrowers with weaker credit, were written in huge numbers, bundled into securities and sold to banks and funds around the world. As long as prices kept rising, the machine seemed to work.
From 2006, home prices began to fall and defaults climbed. In the summer of 2007, two Bear Stearns hedge funds heavily invested in subprime securities collapsed. In August, BNP Paribas froze withdrawals from three of its funds, and banks grew wary of lending to each other.
Even so, on October 9, 2007, the Dow closed at a then-record 14,164.53.
September 2008: the longest month
- March
Bear Stearns, on the brink of failure, was sold to JPMorgan Chase with Federal Reserve backing.
- September 7
Fannie Mae and Freddie Mac were placed into government conservatorship.
- September 15
Lehman Brothers filed for bankruptcy. With about $639 billion in assets, the 158-year-old investment bank became the largest bankruptcy in US history. The same day, Merrill Lynch agreed to be acquired by Bank of America.
- September 16
The Fed extended an $85 billion emergency loan to insurer AIG.
- September 25
Washington Mutual was seized, the largest bank failure in US history.
- September 29
The House rejected the $700 billion rescue plan, and the Dow fell 777 points, its largest one-day point drop at the time.
- October 3
A revised rescue bill passed and was signed into law.
- October 13
After coordinated rescue plans from governments worldwide, the Dow jumped 11.1% in a single day.
The bottom, and a five-and-a-half-year climb back
In December 2008, the Fed cut its benchmark rate to 0–0.25%, effectively zero for the first time. On March 9, 2009, the Dow closed at 6,547.05, 53.8% below its 2007 peak.
The recession ran from December 2007 to June 2009, 18 months in all, and unemployment reached 10% in October 2009. The Dow didn't reclaim its 2007 high until March 2013, roughly five and a half years later.
Another lens: testing a cycle claim against history
That's the familiar story: housing, leverage, failures, bailouts. CycleLab wants to do something different: take an existing cycle claim and check it against the historical record.
CycleLab's stack chart is a historical statistics chart. It slices the Dow's past into segments of equal length and lines them up one above another. It doesn't propose a new theory. It simply lays history out so that claims can be compared against it.
Is there a cycle?
Several "every-dozen-or-so-years" cycle ideas circulate among market watchers. Two come up most often.
A 19-year cycle?
- The Delta Phenomenon: J. Welles Wilder Jr., the creator of the RSI indicator, published this book in 1991, crediting the core idea to trader Jim Sloman. It describes market turns on five time frames, from a few days up to the longest, 19 years.
- 19 years in astronomy: 19 solar years almost exactly match 235 lunar months, a span known as the Metonic cycle. That's why the lunar and solar calendars line up on roughly the same dates every 19 years. Delta's time frames are built on the motions of the sun and moon.
An 18-year cycle?
- The 18-year land cycle: In a study published in 1933, Homer Hoyt traced a century of Chicago land values and found booms and busts roughly 18 years apart. British writer Fred Harrison used the same 18-year rhythm in his 2005 book Boom Bust to discuss the rise and fall of property and bank credit.
- 18 years in astronomy: Solar and lunar eclipses repeat in nearly the same pattern every 18 years and 11 days, a span known as the Saros cycle.
Economist Simon Kuznets also described 15-to-25-year swings, which became known as Kuznets cycles, tied to construction and population changes. That range covers both lengths. So rather than look at 19 years alone, we stacked the Dow at 18, 19 and 20 years and set the three side by side.
How to read the side-by-side chart
The three columns are 18, 19 and 20 years, left to right. Within each column, every row is one segment: time runs across, the Dow runs up, and the view is zoomed to about four years either side of the red line. The red dashed line marks the same relative position in every segment, so you can read straight down and ask: what happened at this point in each era? Rows marked "ref. only" have incomplete data and aren't counted. To see each segment in full, use the buttons under the chart to open the complete stacks.
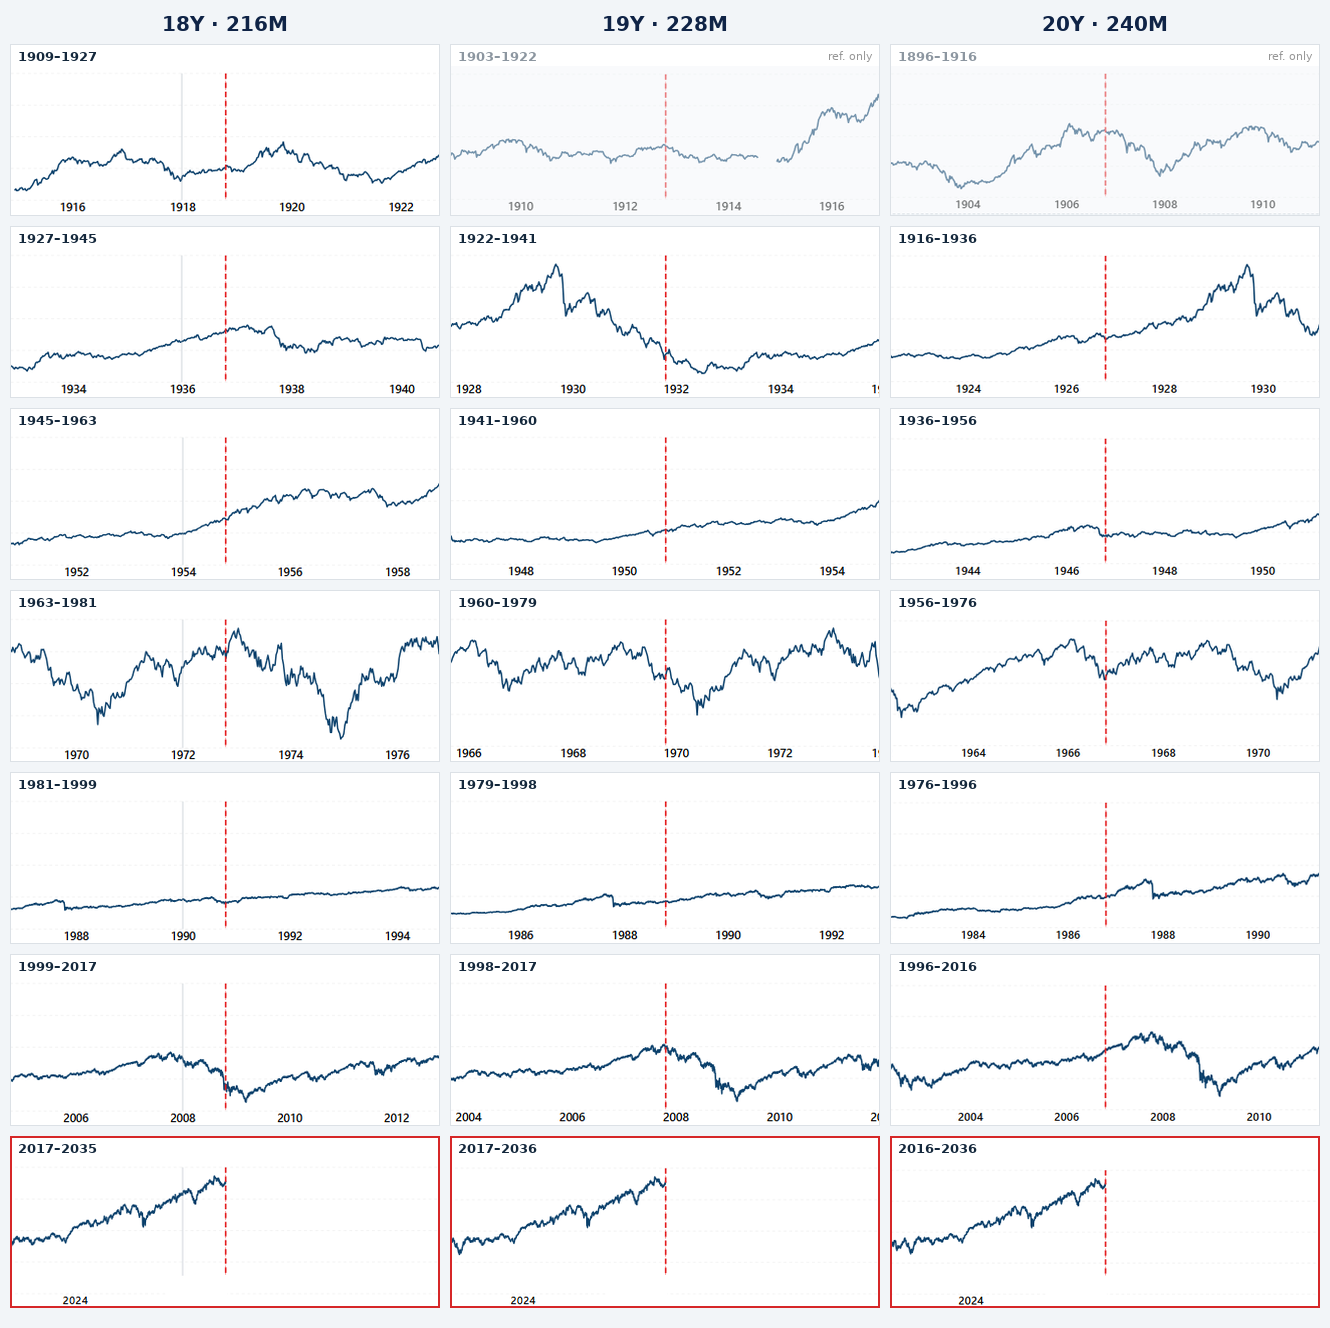
What happened near the red line
| Length | Segments with a major decline near the line | Segments that were calm near the line |
|---|---|---|
| 18 years | 1936, then the 1937–38 bear market; 1972, then the 1973–74 bear market; the 1990 low around the Gulf War; the 2008 financial crisis | 1918, 1954 |
| 19 years | 1931, midway through the Depression decline; 1969, then the 1970 low; 2007, then the 2008–09 crisis | 1950, 1988 |
| 20 years | 1906, then the Panic of 1907; the 1966 bear market low; 2006, then the 2008–09 crisis | 1926 (the market kept rising into 1929), 1946 (just after a sharp drop), 1986 (the crash came a year later, in 1987) |
At all three lengths, the 2008 crisis lands near the red line. But at no length does every segment line up.
Closing
The 2008 crisis has a clear cause and a well-documented sequence of events. Here we placed it back into 130 years of Dow history, stacked at 18, 19 and 20 years, to test the 19-year cycle described in The Delta Phenomenon. Whether that claim holds up against history is for you to judge after looking at the charts.
Explore it yourself: Open the Dow page, switch to 19Y and see what happened near the red line in each segment (members only).This article reviews past events only. It does not project future years and is not investment advice. Data: CycleLab Dow daily data; events compiled from public records (FDIC, Federal Reserve statements and contemporary news reports).